Interferometria
Gdy nawet największy teleskop jest zbyt mały, wtedy pomaga interferometria
When we talk about the size of an optical telescope, like those found at ESO’s Paranal Observatory, we are really referring to the diameter of its primary mirror. The larger the mirror diameter, the higher its resolution — that is, the better its ability to pick out fine detail. The atmosphere degrades this ability, but adaptive optics can partly compensate for this. However, even with the largest telescopes available today, many astronomical objects still just look like a small dot in space. For example, to see details on the surface of one of our neighbouring stars, we would need a telescope with a mirror of over 1.5 kilometres in diameter!
Building mirrors larger than a few metres in diameter is both expensive and difficult as the mirror’s own weight causes it to sag and deform due to the effects of gravity. The use of an active optics system below the mirror to control and compensate for flexures has meant that telescope designers have been able to make the jump from telescopes in the 4-metre class, like the NTT, to the current 8- to 10-metre generation of optical telescopes, like the VLT. Using segmented mirrors, the size limit can be pushed back to a few tens of metres. The planned ELT will have a mirror that is 39 metres in diameter. However, even this is still too small to see the details on the surface of even a nearby star!
For radio astronomy, the fine details are even more difficult to resolve. At an equivalent diameter, a radio telescope has a resolution 1000 times worse than a visible-light telescope simply because radio waves such as those observed by ALMA, are much longer — around 1 millimetre — than those observed by optical telescopes, which have wavelengths of around one thousandth of a millimetre, or 1 micrometre. The longer the wavelength, the lower, and worse, the resolution you can obtain. To be able to pick out the same features as the VLT, a single radio dish with a diameter of several kilometres would be needed.
Astronomers’ hunger for higher resolution led to the application of a new technology called interferometry, first used at radio wavelengths to observe the Sun back in 1946.
So, how does interferometry work? An interferometer combines the light from two or more telescopes, allowing astronomers to pick out the details of an object as though they are being observed using mirrors or antennas measuring hundreds of metres in diameter. The distance between two telescopes, also known as the separation, forms a baseline, which is effectively the diameter of the “virtual” telescope created by the interferometry. When the light from several telescopes is being used the separations between each pair of telescopes each constitute a different baseline, and the effective telescope diameter corresponds to the greatest separation in the array. The more baselines we use, the more information we acquire about an object as each distinct baseline reveals a different piece of the information jigsaw that makes up a complete image. You can think about this in musical terms: if the image of an astronomical object represents the complete song, then each baseline represents the individual notes that make up the piece. The more baselines we have, the more notes we get, and the more complete our version of the song is.
Furthermore, as the Earth rotates, the orientation of the various baselines with respect to the observed object changes, resulting in the acquisition of more information. So the more telescopes we use, the more baselines and information we can acquire. This is the case for both optical and radio interferometry.
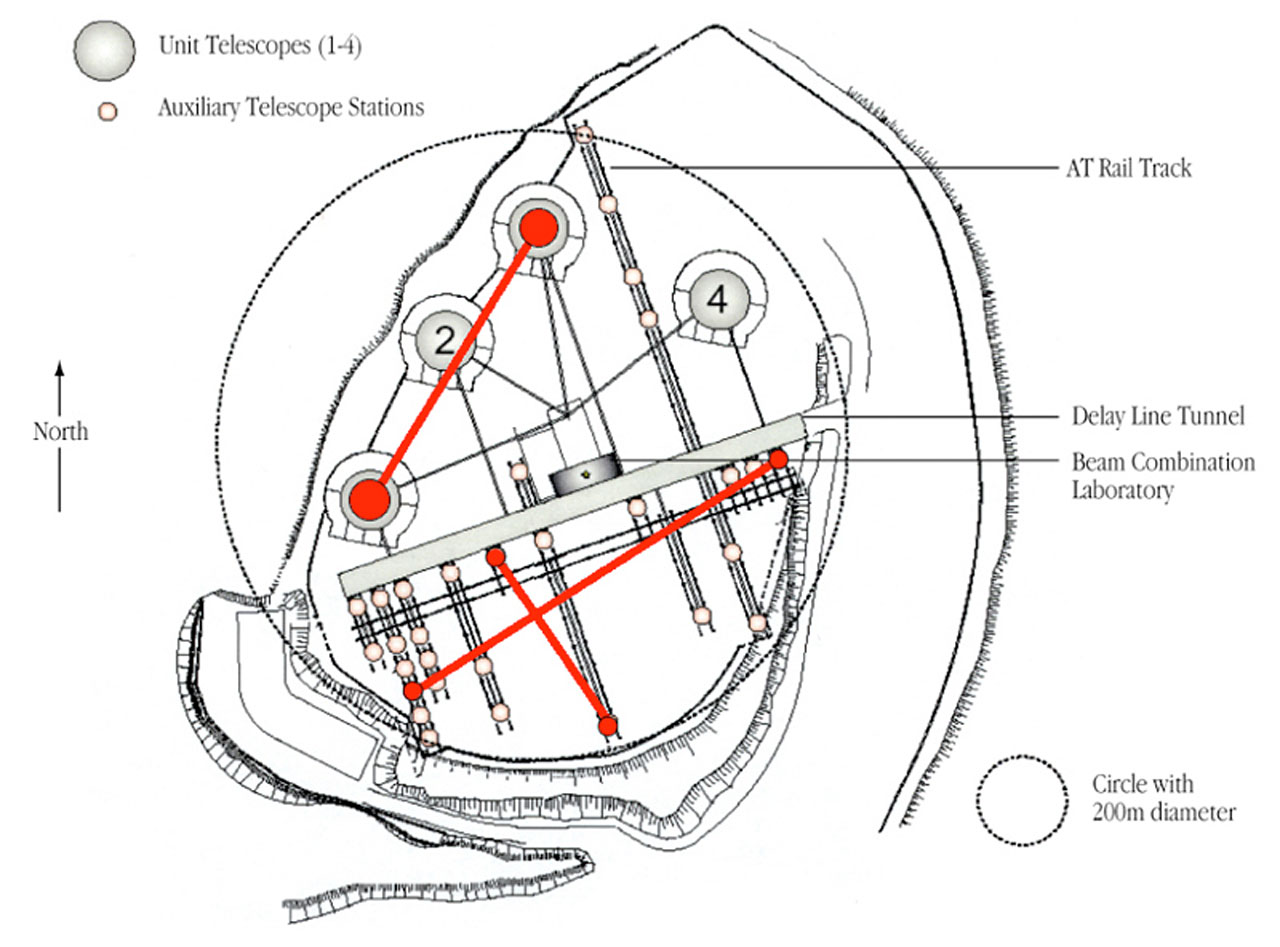
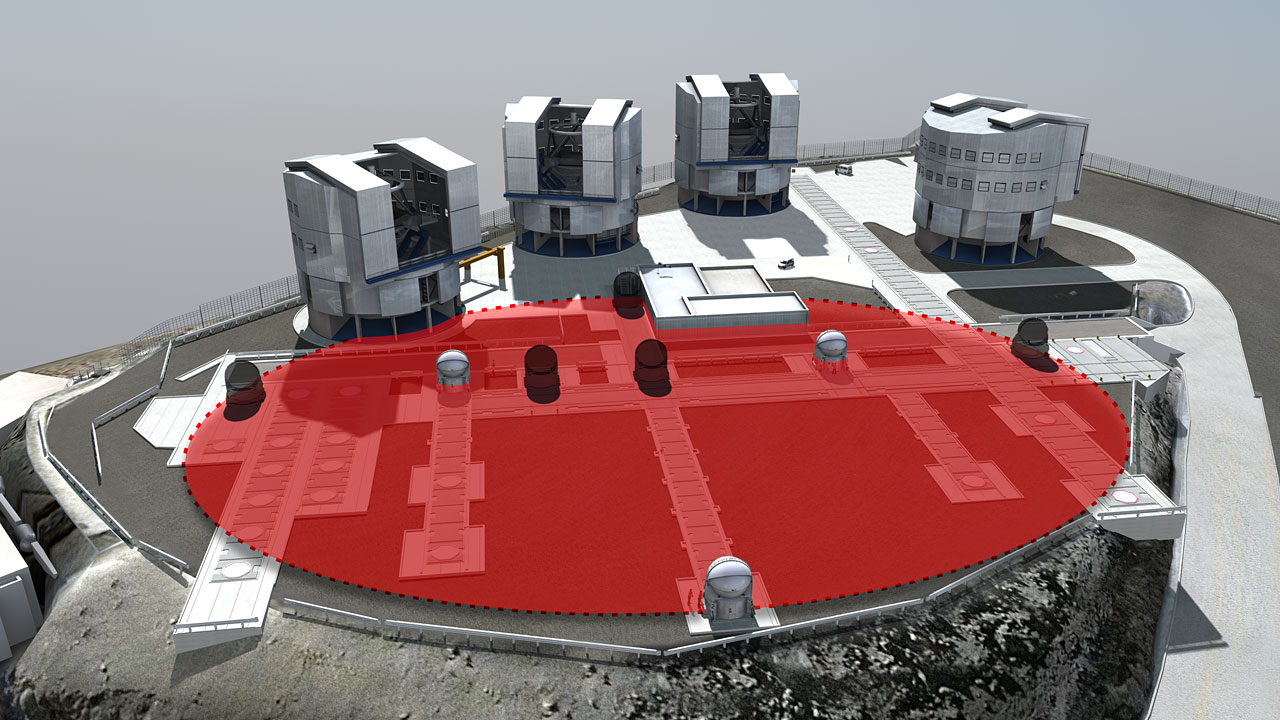
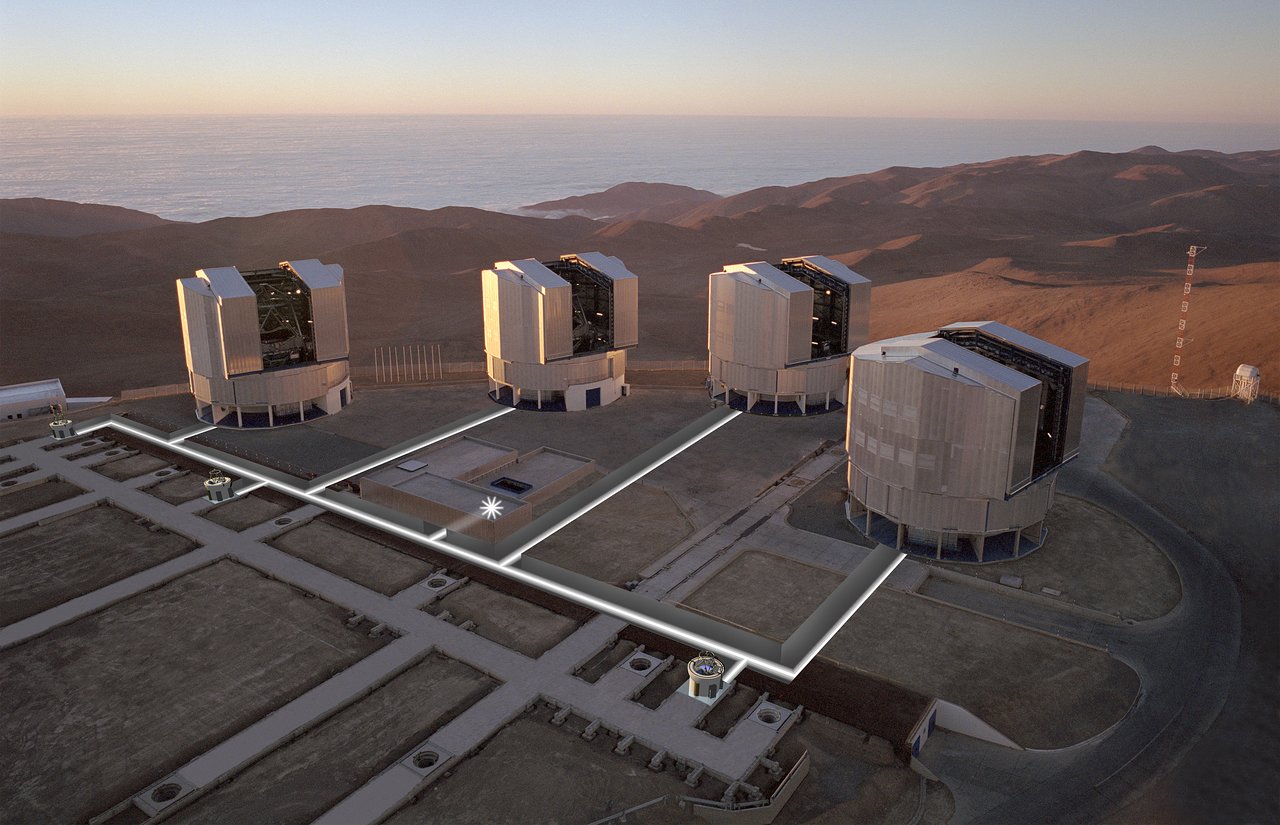
Combining the four Unit Telescopes (UTs) of the VLT gives us six baselines. This is the reason for the strange arrangement of the telescopes on the platform: the lengths and orientations of the six baselines are all different. In principle, the UTs can obtain a resolution equivalent to a telescope of 130 metres in diameter, which corresponds to its largest available baseline. The VLT Interferometer (VLTI) can also make use of four 1.8-metre Auxiliary Telescopes (ATs) that can be moved along the platform to get more information about the object. With the ATs, the VLTI can go even further, with a maximum resolution equivalent to a telescope of 200 metres in diameter and a much larger number of possible baselines. This is an improvement of up to 25 times on the resolution of a single VLT Unit Telescope.
The VLTI gives astronomers the ability to study celestial objects in unprecedented detail. It is possible to see details on the surfaces of stars, and even to study the environment close to a black hole. The VLTI has allowed astronomers to obtain one of the sharpest images ever of a star, with a spatial resolution of only 4 milliarcseconds. This is equivalent to picking out the head of a screw at a distance of 300 kilometres!

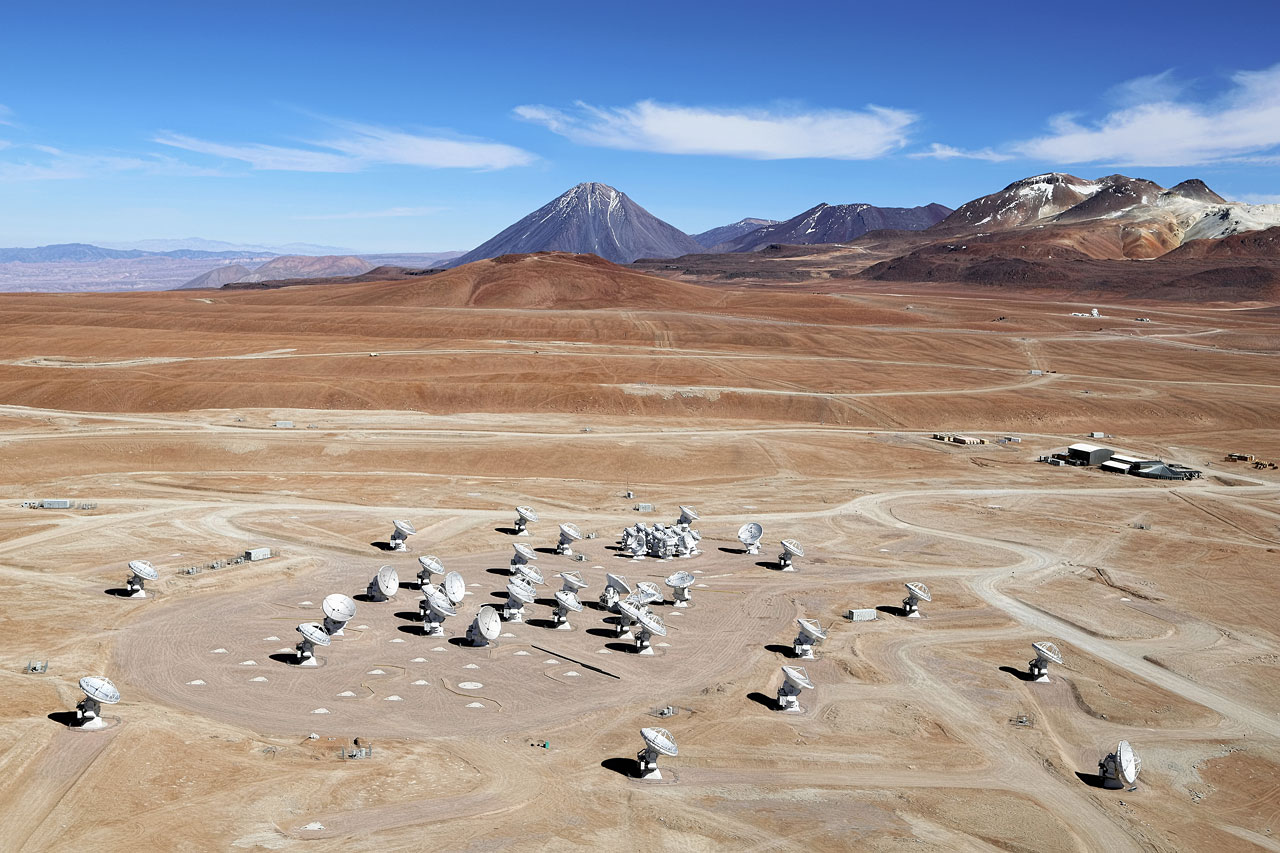
Sieć ALMA z lotu ptaka. Fot.: Clem & Adri Bacri-Normier (wingsforscience.com)/ESO
In radio interferometry, ALMA is leading its own revolution. With the potential to combine up to 66 antennas with 1225 baselines, and a maximum distance between the antennas of 16 kilometres… Well, you do the maths! ALMA has by far the highest resolution available to any radio astronomer, up to ten times better than that achieved by the NASA/ESA Hubble Space Telescope.
Each telescope involved in interferometry observes the same astronomical object, and each picks up some of the light that it emits. However, interferometry only works if the light received by each telescope is successfully combined. Referring back to our musical analogy, we must collect the individual musical notes and combine them in order to acquire the complete song. However, due to how the light waves from the object travel both through space and through the Earth’s atmosphere, they arrive at each telescope at slightly different times. So when the beams are combined each interferometer needs a system to compensate for these tiny time differences in order to ensure that all light beams reach the detector at the same time. In the case of ALMA, radio waves are combined electronically inside the powerful computer called a correlator. Longer wavelengths are easier to combine, which is the reason why radio interferometry developed long before optical.
Shorter wavelengths, like those observed by the VLT, are a completely different story. Even supercomputers like the ALMA correlator are simply not capable of reaching the level of precision needed to successfully combine signals in the infrared domain. It took decades to develop a reliable system for infrared interferometry, like the one used at the VLTI. Instead of a supercomputer, optical/infrared interferometry uses a system of underground tunnels, known as delay lines, These delay lines add a little extra distance into the paths travelled by the earliest arriving waves, introducing compensatory time delays that ensure that all the light waves from the object can be combined correctly. This is achieved by a system of several carriages with mirrors that can move along rails that are the same length as the maximum baseline. By careful positioning of these carriages the incoming signals can be fine-tuned, entering the instrument with an astonishing precision of 1/1000 mm.
So what does the combined light look like? Not very fancy really. Imagine a perfectly still pond and then think of dropping two pebbles into it side by side. Each pebble produces an expanding system of circular ripples, and at some point the two sets of ripples will begin to overlap. Where two wave crests or troughs of the ripples meet, the height of the wave doubles. However, if the crest of one wave meets the trough of another, they cancel each other out. If we swap water for light (an electromagnetic wave), the interaction of the two sets of ripples is known as interference.
Such an interference pattern is similar to the pattern of light and dark stripes (known as interference fringes) that you can see by doing a double slit experiment. The separation and the contrast of the fringes depend on the size and shape of the object observed. Furthermore, the interference pattern can be observed at different wavelengths (colours), or even over a whole wavelength range, as with spectroscopy.
In the early days of interferometry, the limited number of baselines only revealed whether the object was a single source, a double source or extended doubles, but an actual image was unthinkable. Now, the use of highly sophisticated interferometers like ALMA, coupled with a dose of mathematics, mean that astronomers can produce a picture almost as detailed as the one obtained with a full-size mirror hundreds of metres in diameter or a giant antenna several kilometres wide. Thinking again of the notes in a piece of music, one could say that interferometry is truly revealing the harmony of the Universe.
Science Highlights with Interferometry
- MIDI clearly resolves star WOH G64 to discover it is not as big as previously thought! (eso0815)
- VLTI detects exo-zodiacal light using PIONIER (eso1435)
- Revolutionary ALMA image reveals planetary Genesis (eso1436)
- VLTI finds dust at unexpected places above and below the plane of the disk surrounding the supermassive black hole in an active galaxy (eso1327)
- VLTI detects a very small companion in the protoplanetary disk around the star T Cha (eso1106)
Additional images
- More images related to ESO interferometry
- ‘ESOcast 13: A sharper view of the Universe with the VLT Interferometer’ gives a great video overview of the methods described here.


