- What are the three main sources of light in galaxies
- How astronomers use different telescopes and instruments to observe them
- How to understand the physics behind colorful images of galaxies
Galaxies are complex systems of stars, gas and dust swirling together to the tune of gravity [1]. These three ingredients emit light at different colors or wavelengths; most of this radiation is invisible to the human eye, but it can be detected with specialized instruments. By assigning colors to these data and combining them we can produce impressive images of galaxies . This article is intended to help you understand the physics behind these images, so that you can appreciate them under a completely different new light.
Ingredient # 1: Stars
Not all stars are born equal. When a gas cloud fragments and collapses, the resulting stars span a large range of properties. Some –– very few –– are several times more massive than our Sun, very luminous and hot, and prominently blue. But most stars have just a fraction of our Sun's mass and are much fainter, colder and redder.
Another key difference between high- and low-mass stars is their lifespan. Massive blue stars, despite having more nuclear fuel, burn through it very quickly, resulting in very short lifetimes of just a few million years. Our Sun, in comparison, is half way through its 10 billion-year-long life. And less massive redder stars live 10-100 times longer than that.
Therefore, color gives us a good idea of the average age of the stars in galaxies: since massive blue stars are very short-lived, blue colors are a sign post of recent star formation.
This is clearly illustrated in this image taken with the FORS2 instrument at ESO’s Very Large Telescope (VLT) in northern Chile. NGC 470, the spiral galaxy to the lower right, is much bluer than NGC 474, the elliptical galaxy to the upper left, indicating that stars in NGC 470 are, on average, younger than those in its elliptical neighbour.
Moreover, we can also see colour variations within the spiral galaxy itself, whose outskirts are bluer than the inner regions. This is in fact very common in spiral galaxies, and tells us that these galaxies grow from inside out.
Ingredient #2: Gas
The gas out of which stars form is mostly hydrogen. The intense light of young massive stars excites the electrons in hydrogen atoms, and when these electrons eventually cascade back to lower energies they emit light at very specific wavelengths, producing so-called emission lines.
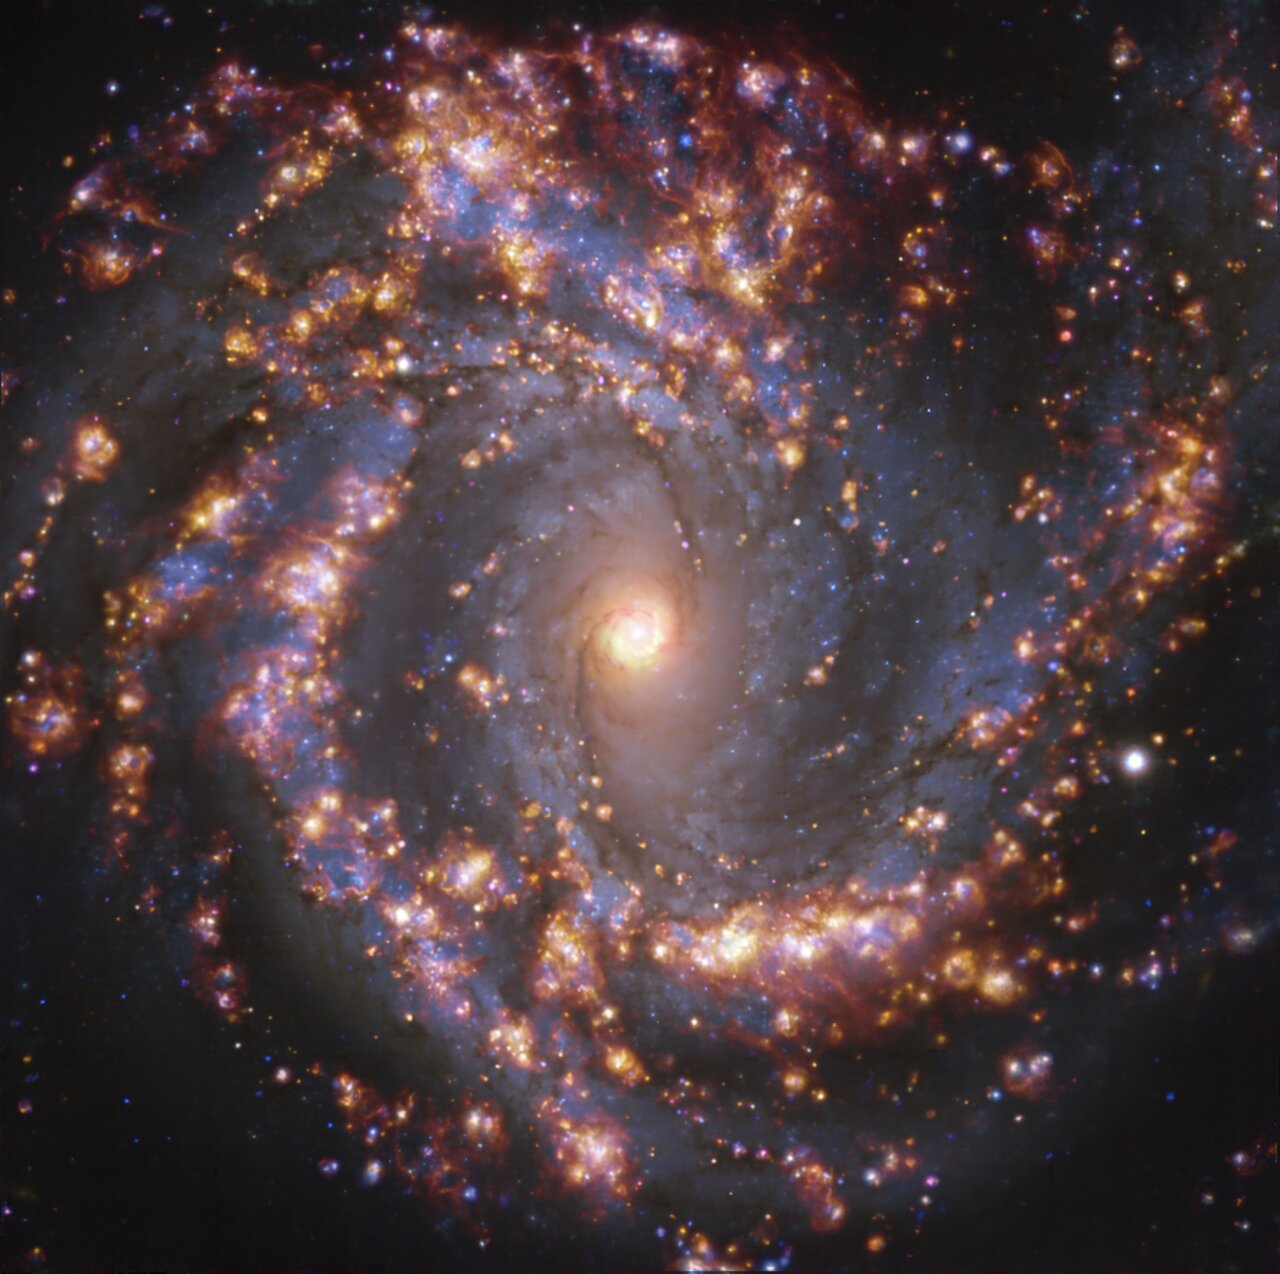
The most prominent emission line in star-forming regions is called H-alpha (Hα), and has a characteristic red colour. One way to spot star-forming regions in galaxies is to use a filter that only lets through Hα light, like in this VLT image of the spiral galaxy NGC 4303, where star-forming regions pop up in red.
But this technique has a drawback. First, hydrogen atoms emit light at wavelengths other than Hα. Secondly, star-forming regions contain other elements besides hydrogen, each one with its own set of emission lines. Therefore, to properly map these stellar nurseries one has to observe them through various filters targeting different colours, which can be very time consuming.
Enter MUSE, another instrument at ESO’s VLT. Instead of capturing an image, MUSE produces something called data-cubes, which can be thought of as ensembles of thousands of different images at different colours, taken all at once. This allows astronomers to accurately map many physical properties of galaxies: the chemical makeup of the gas, the age and composition of the stars, and even the speed at which the gas and stars are moving, all with a single observation.


Hα observations reveal gas lit up by already ongoing star formation, but is it possible to see gas before it transforms into stars? The answer is yes, but for that we need radio-telescopes instead of optical ones.
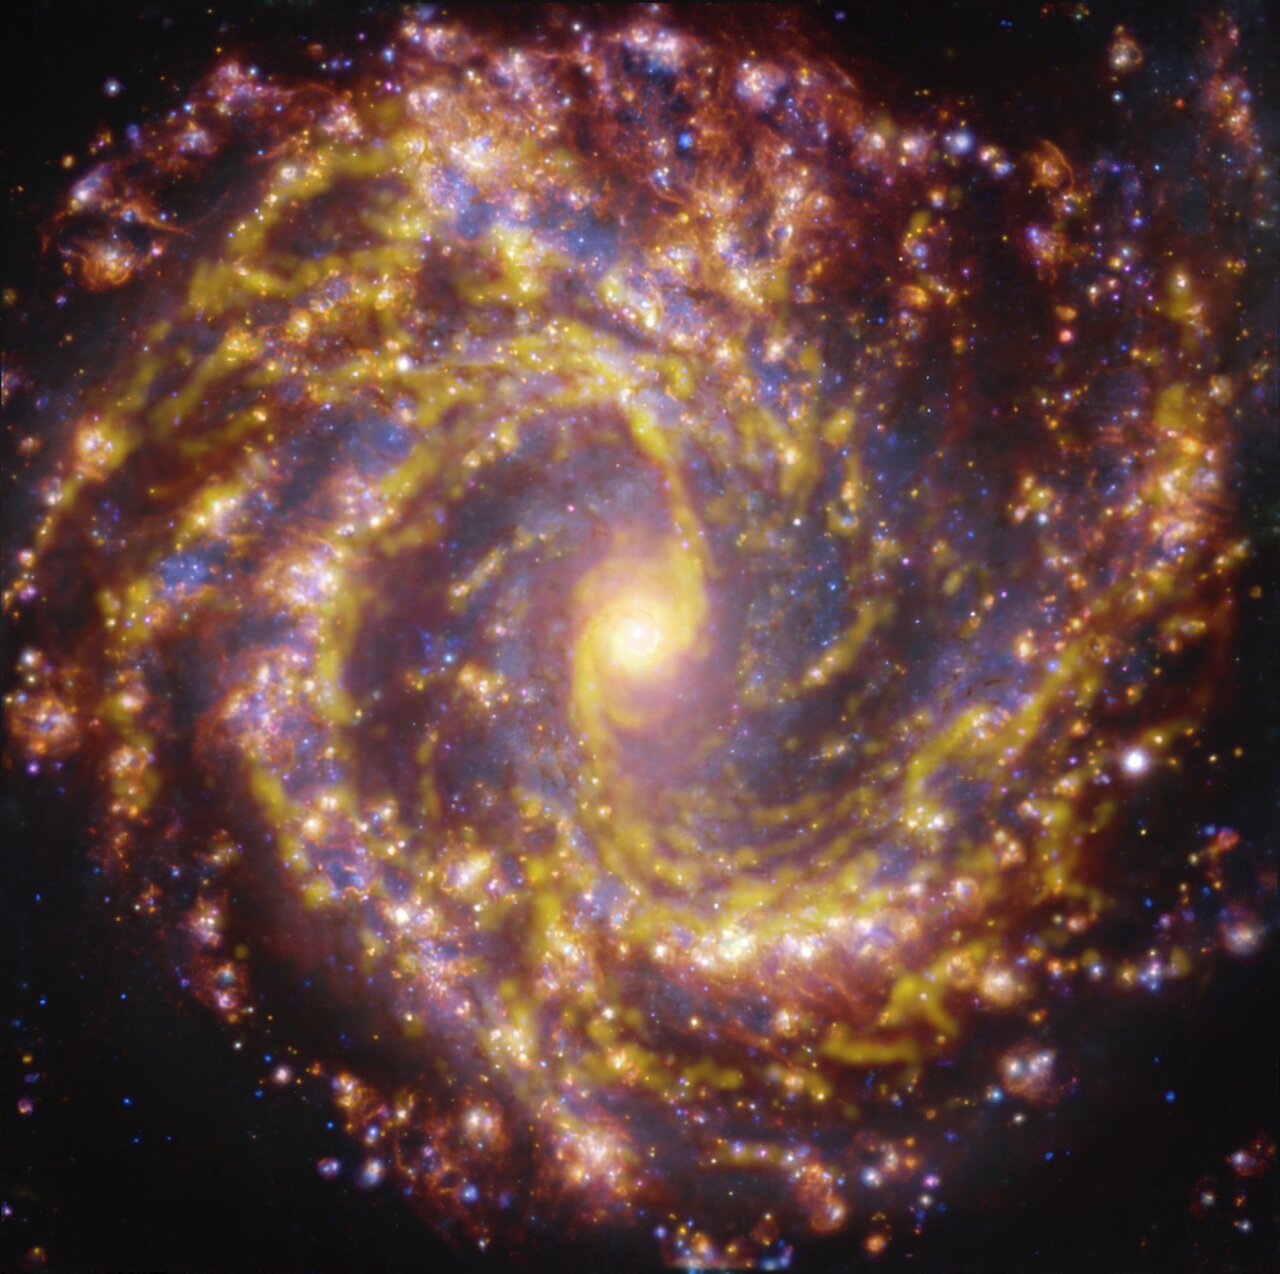
Most of the hydrogen in galaxies is in the form of individual atoms, but when gas clouds collapse and become denser, pairs of hydrogen atoms bond to each other forming molecules. Molecular hydrogen is the raw material out of which stars form, and we can map its distribution with the Atacama Large Millimeter/submillimeter Array (ALMA), an array of 66 antennas in northern Chile of which ESO is a partner [2].
The interactive comparison to the right allows you to overlay the ALMA map of molecular gas in NGC 4303 over the MUSE one showing star-forming regions. The ALMA image tells us where star formation could potentially happen; the MUSE one shows where it actually happens. Comparing both maps allows astronomers to figure out which mechanisms boost or inhibit the conversion of gas into stars.
Ingredient #3: Dust
As stars evolve, they fuse hydrogen into helium and heavier elements, which are eventually injected into the interstellar medium when stars die. Some of these heavy atoms will end up polluting subsequent generations of stars, maybe even forming planets around them. Others will remain floating in space, coalescing into tiny grains of dust that obscure our view of the stars.
We said earlier that blue and red regions in galaxies indicate young and old stars, respectively. But dust complicates this, because it absorbs and scatters blue light more efficiently than red light, making stars look redder, just like the Sun does when it's close to the horizon.
Luckily, there is a way to figure out how much reddening is due to dust alone. When dust absorbs starlight it warms up, and by observing this thermal emission we can work out how much dust there is.
Hot dust grains emit infrared radiation, which is largely blocked by the Earth’s atmosphere, but can be easily observed with space telescopes. Colder dust grains, on the other hand, can be detected from the ground using radio-telescopes like ALMA or the Atacama Pathfinder Experiment (APEX), a 12-metre antenna close to ALMA and operated by ESO. The image to the right shows APEX observations of cold dust in a nebula within our own galaxy, overlaid in orange over an image of the same region taken in visible light. Note how dust appears as dark filaments in the optical image, but glows in the APEX one.
Mixing all the ingredients together
While the basic aspects of star formation and evolution are well understood, there are still many unanswered questions: why do stars form more efficiently in some regions of galaxies than in others? How does this affect the evolution of galaxies as a whole? The MUSE and ALMA images in this post were taken as part of the Physics at High Angular resolution in Nearby GalaxieS (PHANGS) project, which aims to answer those and other questions.
While we await those answers, we hope this crash course on galaxy imaging will help you appreciate these spectacular images under a whole new light.
Notes
[1] While these are the three luminous components of galaxies, the gravitational interaction that keeps them together comes mostly from dark matter, which doesn’t absorb or emit any light.
[2] Molecular hydrogen is actually very hard to observe directly, as it paints prominent spectral lines. Instead, astronomers use carbon monoxide as a proxy for it; it is much easier to observe, and it closely follows the distribution of the more elusive molecular hydrogen.
Biography Juan Carlos Muñoz Mateos
Juan Carlos Muñoz Mateos is Media Officer at ESO in Garching and editor of the ESO blog. He completed his PhD in astrophysics at Complutense University in Madrid (Spain). Previously he worked for several years at ESO in Chile, combining his research on galaxy evolution with duties at Paranal Observatory.


